
Learn more about the REMX ETF on the VanEck website here.
And learn more about J.C. Parets in this excerpt from his website below,
My timeframe is simple: I look out weeks and months. I am not a day-trader, but I also don’t care what happens next year. It’s an intermediate-term time horizon. Not long-term and not too short-term either.
I use candlestick charts for my every day charting. Once a week I go through the 3000 charts in my arsenal with just bars. No moving averages or momentum or anything else on the chart – just bars. You’d be surprised how much you can see when you simply get everything the heck out of the way.
For ratio analysis I use line charts. This helps with the day to day or week to week changes in a ratio. Remember that not everything opens up every day at the same time. If you’re using candlesticks or bar charts for ratios, you’re going to have bad data all the time, most of the time really. So line charts are very useful to me as well.
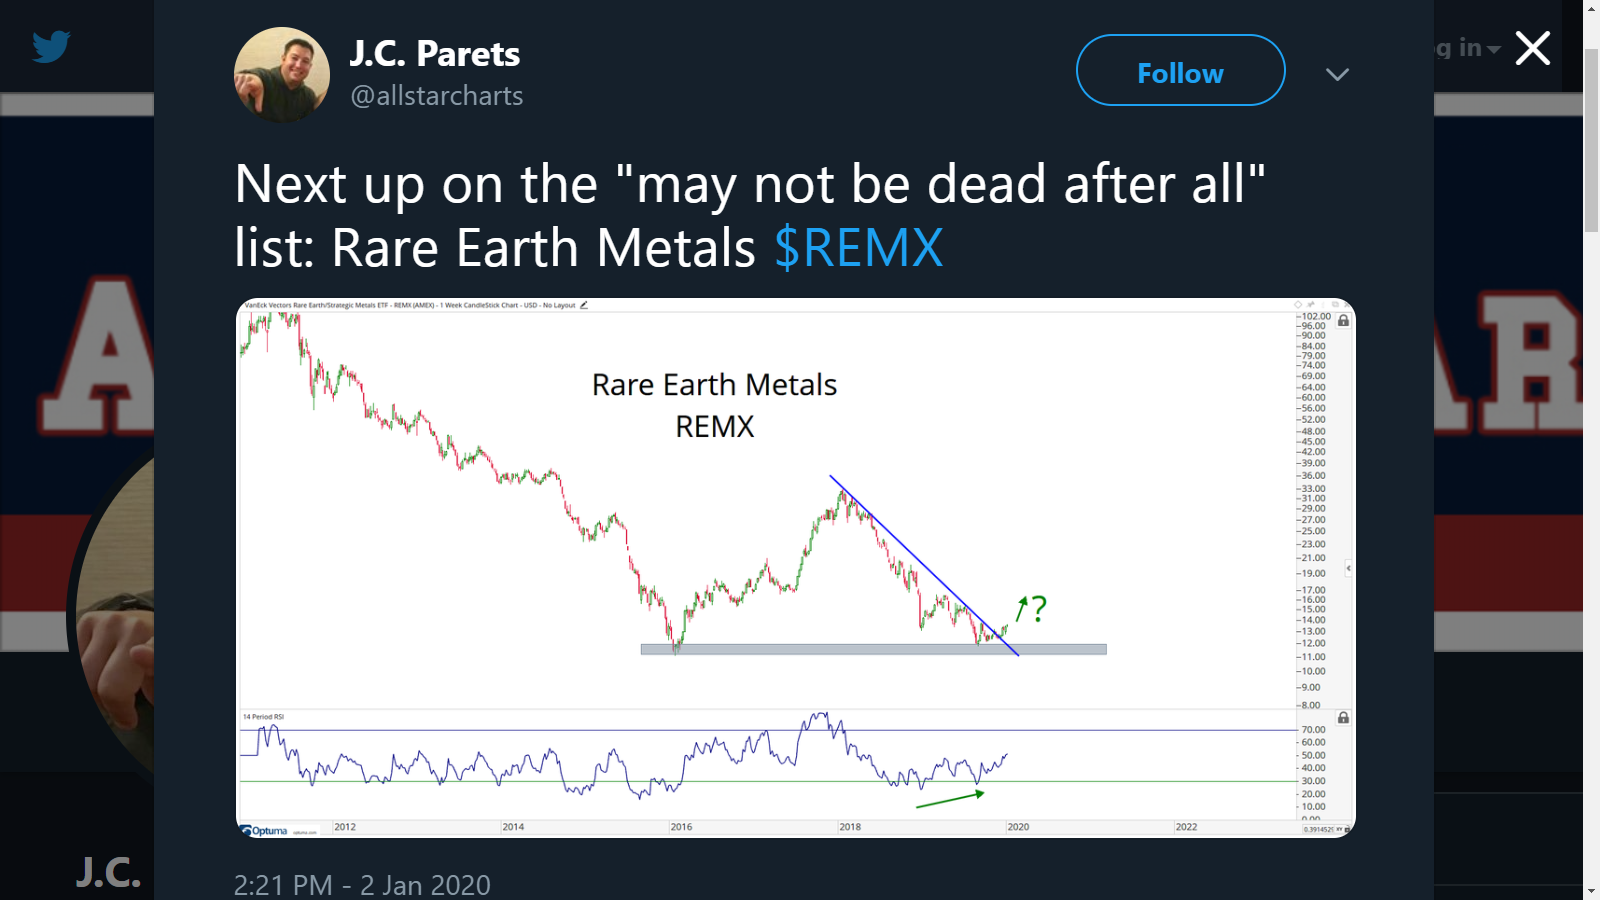
For momentum I use a 14-period Relative Strength Index, or RSI as the cool kids call it. I don’t change my RSI periods and I don’t smooth them out like others do. Not that there is anything wrong with that, it’s just that 14-periods works for me. Also, when I say “periods”, I mean daily and weekly. So if I’m looking at a chart with weekly candles I’m using a 14-week RSI. If we’re analyzing a daily chart, I’m using a 14-day RSI. See: (JC and Momentum)
Smoothing Mechanisms: I only use a 200 period simple moving average. This is for both daily and weekly timeframes (like in momentum). I’m pretty sure I picked this one up years ago from Paul Tudor Jones. For my timeframe a 50 period moving average is too noisy. It doesn’t help, it just hurts. Also, I don’t use moving averages for support and resistance purposes as I see being done so frequently. This is an invisible line, as far as I’m concerned, with no supply and demand history whatsoever. Therefore I use the smoothing mechanism to help with trend recognition. Is it an upward sloping 200 day? Downward sloping? Or is it flat? I hate when prices are near flat 200 period moving averages (see here: Price Near Flat 200 Day = Headaches).
I don’t look at volume on stock charts. Sorry Charlie Dow. I know this is sacrilegious in some circles but I don’t really care. Charlie Dow wrote down his Dow Theory Tenets in the late 1800s well before the derivative markets existed. I think that volume can be seen elsewhere, not just in stock charts. If someone really wants in, are they going to buy the common? Or are they going to use options leverage? It depends. So my point is we don’t know. I look at volume just to make sure a market is liquid enough market for me to participate in, but that’s it. It’s not a confirmation of any kind for me, just more noise. (see here: 5 Things Every Investor Should Know About Dow Theory)
I think you guys get the idea. There are other tools that I use like Sentiment and Correlation analysis to supplement all of the price activity across markets. But in terms of my chart by chart work, this is my process and it is as a result of many failures and successes over a lot of years. It’s not perfect and it’s always a work in progress. I think you need to be a fool to think your process has been perfected.
The market has taught me, the hard way, to check my ego at the door and always remember that none of us know anything. It doesn’t matter how loud they get on TV, how many blog posts they write about a subject, or how long they’ve been the Chief Strategist of **fill-in-the-blank** sell side wall street firm, they don’t know anything that you don’t know about what will happen tomorrow or next year. This is a fact. So it all boils down to how well you manage risk. Remember, it’s not about being right, it’s about making money.
About